%201.svg)


HIPAA Compliance Checklist for 2025

The modern enterprise runs on SaaS. From collaboration tools like Slack and Zoom to security platforms and CRMs, SaaS applications are woven into every department. But while SaaS offers speed and scalability, it also creates complexity. IT teams often struggle to answer basic question.
Organizations often ask themselves critical questions about their SaaS portfolio: How many applications are we actually paying for, and which ones are underutilized or worse, entirely unused? Are redundant tools quietly draining budgets without delivering value?
Do we have clear visibility into security scores, compliance risks, and overall usage patterns? Answering these questions is essential for optimizing spend, mitigating risk, and ensuring that every SaaS investment drives tangible business outcomes.
The average company now manages around 254 SaaS applications, with large enterprises using as many as 364 SaaS apps, making comprehensive tracking essential for IT governance. Without visibility into SaaS metrics, IT leaders risk wasted spend, compliance failures, and shadow IT creeping across the business.
That’s why tracking the right key SaaS metrics is critical. These metrics shine a light on usage patterns, cost optimization opportunities, and security vulnerabilities, giving IT and procurement leaders the data they need to make smarter decisions.
In this blog, we’ll break down the most important SaaS management metrics, why they matter, and how platforms help IT teams centralize, automate, and act on SaaS insights.
TL;DR
- Track the right SaaS metrics - Visibility, utilization, and spend efficiency are essential to control costs, eliminate waste, and ensure compliance.
- Data silos hurt decisions - When IT, finance, and security work in isolation, it leads to shadow IT, overspending, and risk exposure.
- Core metrics to monitor - License utilization rate, SaaS visibility score, shadow IT risk index, renewal preparedness, and redundant app overlap.
- Automation is key - Real-time dashboards and alerts enable proactive governance, smarter renewals, and cost optimization.
- CloudEagle.ai advantage - Centralizes SaaS insights, automates discovery, and empowers IT teams to turn SaaS data into measurable business outcomes.
What Are SaaS Management Metrics?
SaaS management metrics are quantifiable data points that indicate a Software as a Service (SaaS) company's performance, health, and growth by tracking financial, customer, and operational aspects of the subscription-based model. These metrics, such as Monthly Recurring Revenue (MRR), Customer Lifetime Value (CLV), and Churn Rate, provide insights to help businesses make data-driven decisions, optimize strategies, and ensure long-term growth.
Why SaaS Management Metrics Are Critical for Modern IT Teams
SaaS adoption is exploding, but most organizations underestimate just how many apps they have. According to industry studies, the average mid-sized company uses over 250 SaaS applications, and a large enterprise may have 500+.
The challenge?
- Many apps are purchased outside IT (shadow IT).
- Licenses often sit unused, eating into budgets.
- Departments procure overlapping tools without coordination.
- Security and compliance blind spots put the business at risk.
By tracking software as a service metrics, IT teams can move from reactive firefighting to proactive governance, ensuring SaaS investments drive value instead of waste.
Why Is SaaS Reporting Important?
Organizations use only 47% of their SaaS licenses, leaving more than half underutilized and resulting in substantial wasted spend each year. SaaS reporting provides IT leaders with a single source of truth for spend, utilization, and security. Without reporting:
- Procurement teams can’t negotiate renewals effectively.
- Finance teams can’t forecast budgets accurately.
- Security teams can’t ensure compliance or vendor oversight.
In short, SaaS metrics reporting translates raw usage data into actionable intelligence.
Key Benefits of Tracking SaaS Metrics
- Cost Optimization – Identify unused or duplicate licenses.
- Improved Security – Monitor applications with weak security scores or no SSO/SAML.
- Governance – Ensure every app has an owner and is compliant with internal policies.
- Productivity – Eliminate redundant tools that confuse employees.
- Data-Driven Renewals – Negotiate with vendors using real usage data instead of guesswork.
Strategic SaaS Metrics Every Executive Should Track
Beyond license usage and spend, organizations should track key business metrics to measure SaaS performance and growth. These metrics provide actionable insights for CIOs, CFOs, and CISOs to make data-driven decisions, optimize strategies, and ensure long-term growth.
1. SaaS Visibility Score
Evaluates how much of your SaaS landscape is under IT oversight. In many enterprises, employees procure and use software independently, creating shadow IT and increasing risk. By identifying all applications in use including those acquired outside official channels, you can expose hidden vulnerabilities, compliance gaps, and cost inefficiencies.
What It Measures: The percentage of SaaS apps in use that are known and approved by IT.
Why It Matters: Visibility is the foundation of governance and cost control. Without it, managing risk and spend is impossible.
Formula: (Number of IT-approved SaaS apps ÷ Total SaaS apps in use) × 100
2. License Utilization Rate
Indicates how effectively purchased SaaS licenses are being used. Organizations often over-license during onboarding or renewals without analyzing real usage, causing financial waste. This metric helps IT and Finance pinpoint areas for rightsizing.
What It Measures: Active usage of SaaS licenses compared to total licenses purchased.
Why It Matters: Maximizes cost efficiency and ensures software spend matches actual employee engagement.
Formula: (Number of actively used licenses ÷ Total purchased licenses) × 100
3. SaaS Spend Efficiency Ratio
Measures how well SaaS spend translates into business value. It connects spend with actual adoption and feature usage. A high ratio reflects optimized investments; a low ratio signals underuse or misalignment.
What It Measures: Return on SaaS investment based on adoption and usage data.
Why It Matters: Helps CIOs and CFOs assess spend effectiveness and identify underperforming tools.
Formula: Total SaaS Spend ÷ (Active users × Feature adoption score)
4. Shadow IT Risk Index
Quantifies the extent of unapproved or unmonitored software in use. These tools bypass procurement and IT, creating blind spots across the stack. This metric highlights unmanaged spend and usage outside policy.
What It Measures: The percentage of SaaS spend that’s unapproved or unmanaged by IT.
Why It Matters: Shadow IT drives hidden security threats, compliance risks, and redundant costs. Addressing it reduces vulnerabilities and tool sprawl.
Formula: (Unapproved SaaS spend ÷ Total SaaS spend) × 100
5. Access Review Completion Rate
Tracks how many critical applications have undergone user access reviews. Regular reviews ensure appropriate access levels and support SOC 2 and ISO 27001 compliance while reducing insider risk.
What It Measures: The percentage of critical apps with completed access reviews.
Why It Matters: Strengthens security, improves audit readiness, and enforces least-privilege access. Builds trust in IT governance.
Formula: (Number of apps with completed access reviews ÷ Total critical apps) × 100
6. Provisioning/Deprovisioning SLA
Captures the average time to grant or revoke SaaS access during onboarding and offboarding. Timeliness impacts both employee experience and security posture.
What It Measures: Average time to provision or deprovision user access.
Why It Matters: Influences productivity, onboarding SLAs, and security resilience. Useful for benchmarking IT efficiency.
Formula: (Total time to provision or deprovision ÷ Number of users provisioned or deprovisioned)
7. License Reclamation Rate
Reflects how well your organization identifies and recovers unused or inactive licenses for reuse. Proactive reclamation avoids unnecessary purchases and boosts ROI.
What It Measures: The percentage of inactive licenses that have been successfully reclaimed.
Why It Matters: Prevents overspending and improves utilization of existing entitlements.
Formula: (Number of reclaimed licenses ÷ Number of inactive licenses identified) × 100
8. Renewal Preparedness Score
Assesses how ready your team is for upcoming renewals—factoring in usage data, benchmark pricing, contract terms, and timelines. Lack of preparation often leads to missed savings or auto-renewals.
What It Measures: The percentage of upcoming renewals supported by actionable data.
Why It Matters: Enables stronger negotiations, minimizes surprises, and drives cost efficiency.
Formula: (Renewals with usage + benchmark data ÷ Total upcoming renewals in next 90 days) × 100
9. Overprivileged Access Ratio
Identifies users with admin or elevated permissions beyond their role. Excessive privileges raise insider threat risk and weaken compliance posture.
What It Measures: The percentage of users holding unnecessary elevated access.
Why It Matters: Enforcing least-privilege policies reduces risk exposure and simplifies audits.
Formula: (Users with unnecessary elevated access ÷ Total users) × 100
10. Redundant App Overlap Score
Reveals how many applications provide duplicate functionality. Independent team purchases often lead to overlapping tools, wasted spend, and operational inefficiencies.
What It Measures: The percentage of apps with overlapping capabilities within the SaaS stack.
Why It Matters: Consolidating redundant tools cuts costs, improves efficiency, and simplifies vendor management.
Formula: (Number of overlapping apps ÷ Total apps in stack) × 100
How CloudEagle.ai Elevates SaaS Metrics Tracking
In many organizations, SaaS data lives in silos - IT tracks usage, finance monitors spend, and security manages access. This fragmented approach often leads to reactive decision-making, overspending, and compliance risks.
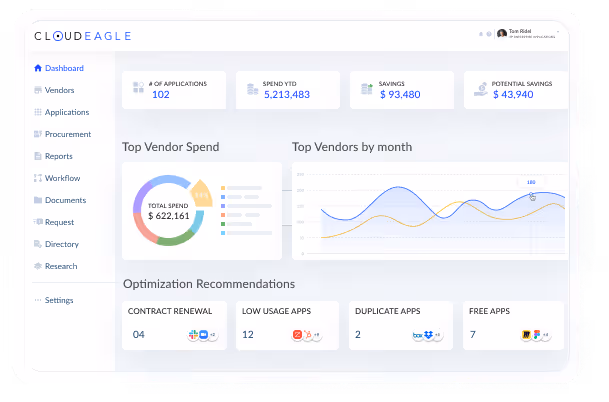
CloudEagle.ai solves this by bringing all SaaS insights - usage, spend, access, and compliance, into a single, intelligent dashboard. This unified view helps IT, finance, procurement, and security teams collaborate better, make informed decisions, and eliminate waste across the SaaS stack.
A. Comprehensive SaaS Discovery
CloudEagle.ai automatically uncovers every application in use, including those purchased with personal cards or trial accounts. By revealing shadow IT, it ensures organizations have complete visibility into their SaaS ecosystem, helping reduce security and compliance blind spots.
B. Centralized SaaS Insights
Instead of juggling spreadsheets and disconnected tools, teams get a single source of truth. The platform consolidates license utilization, spend trends, vendor details, and access metrics, making it easier to identify unused licenses, redundant subscriptions, and compliance gaps.
C. Key Metrics at a Glance
- License Utilization: See who’s actually using assigned licenses and reclaim underused ones.
- Spend Visibility: Track SaaS costs by app, department, or user and uncover hidden overspending.
- Access & Compliance: Monitor user access to meet security standards like SOC 2 and ISO 27001.
- Renewals & Contracts: Stay ahead of renewals with alerts and insights for better vendor negotiations.
D. Proactive Monitoring & Automation

Real-time alerts and automated reports ensure teams can act before small inefficiencies turn into big losses. CloudEagle.ai benchmarks key metrics like usage and spend, empowering teams to optimize continuously.
By unifying SaaS intelligence, CloudEagle.ai helps organizations move from reactive firefighting to proactive governance - reducing costs, improving compliance, and driving operational efficiency across every department.
Conclusion
SaaS has become the backbone of modern IT, but without the right visibility, it can quickly spiral into overspending, compliance gaps, and security risks. Tracking the right key SaaS metrics ensures IT teams stay in control, eliminating waste, reducing risk, and enabling smarter decisions.
With CloudEagle.ai, IT leaders get more than metrics, they get a platform that automates SaaS discovery, centralizes insights, and drives action. By combining dashboards, alerts, and AI-driven optimization, CloudEagle.ai transforms SaaS management from guesswork into strategy.
Want to reduce SaaS waste and boost IT efficiency?
Book a demo with CloudEagle.ai to see how automated SaaS metrics tracking can transform your organization.
FAQs
What is a KPI in SaaS?
A KPI in SaaS is a measurable value that indicates how effectively a SaaS application is meeting business goals (e.g., license utilization rate).
What is the rule of 40 in SaaS metrics?
It’s a benchmark for SaaS companies where growth rate + profit margin should equal 40% or higher.
What are the 5 pillar SaaS metrics framework?
Revenue, churn, customer acquisition cost (CAC), customer lifetime value (LTV), and gross margin.
What is the 3 3 2 2 2 rule of SaaS?
A guideline for SaaS growth: triple revenue for the first two years, then double for the next three.


.avif)


.avif)
.avif)


.png)