.avif)
%201.svg)


HIPAA Compliance Checklist for 2025


Cloud downtime isn’t just an engineering problem; it becomes a revenue, trust, and SLA problem fast. Cloud infrastructure monitoring tools reduce that risk by turning metrics, logs, and traces into actionable alerts, service context, and faster root-cause isolation.
This guide reviews 10 cloud infrastructure monitoring tools for uptime, performance, and system health, with clear best-fit guidance and pricing notes.
TL;DR - Cloud Infrastructure Monitoring Tools
The shortlist below highlights cloud infrastructure monitoring platforms that balance depth, scale, and cost:
1. Cloud Infrastructure Monitoring Platforms: What You Need To Know?
A cloud infrastructure monitoring platform is software that tracks the performance, availability, and security of cloud-based systems and applications. It monitors key metrics such as CPU load, memory usage, and network traffic, giving teams visibility into the health of their infrastructure.
These platforms also provide real-time insights that help with resource allocation, issue detection, compliance, and overall operational efficiency. They are essential for maintaining uptime, improving user experience, and ensuring that complex IT environments run smoothly.
2. What Do Cloud Monitoring Tools Do?
Cloud infrastructure monitoring tools collect metrics, logs, and traces, then correlate them into alerts, dashboards, and incident context your team can act on.
- Actionable Observability: Distinguish genuine SLO breaches from noisy alerts by context-tagging distributed request paths and signals.
- Reduced MTTR: Route incidents to the right owner with deduped alerts, runbooks, and escalation policies.
- Security signals: Detect anomalous traffic, auth failures, and API error spikes early (and preserve audit trails).
- Cloud Cost Optimization: Monitor spend-variance signals and idle resources to trigger capacity reviews and maintain budget forecasts.
- Operational Automation: Replace manual dashboards with cloud monitoring platforms that trigger PagerDuty escalations and auto-scaling runbooks without human intervention.
3. What Should a Modern Infrastructure Monitoring System Cover?
Cloud infrastructure monitoring provides comprehensive visibility across your entire compute and network stack. Key elements of a robust monitoring strategy include:
- Extensive Coverage: Monitor physical and virtual hosts, Kubernetes clusters, containers, and managed cloud services like RDS, queues, and serverless functions.
- Hybrid Data Collection: Use agents for deep telemetry and cloud APIs for managed services and account-level visibility.
- Automated Service Discovery: Use tagging and labeling conventions to maintain ownership context and automate resource registration as infrastructure scales.
- Dependency Mapping: Link metrics, logs, and traces to a service graph to identify how infrastructure degradation affects upstream application performance.
- Actionable Telemetry: Prioritize operational signals like saturation, error rates, and SLO burn rates over simple resource availability checks to improve incident response.
4. Which Cloud Metrics Matter Most for Cost, Security, and Reliability?
Not all metrics deserve equal attention. Before evaluating any cloud monitoring platform, map the signals you need to the problem you're solving, cost overruns, security blind spots, or IT workload, so you can verify during a trial that the tool surfaces the right data without drowning your team in noise.
5. 10 Cloud Infrastructure Monitoring Tools Reviewed
We evaluated cloud infrastructure monitoring platforms for coverage, setup speed, pricing clarity, and noise reduction. Here are the top 10 tools:
1. CloudEagle.ai
CloudEagle.ai is a SaaS procurement and management platform that helps IT, finance, and procurement teams gain complete visibility into their SaaS ecosystem while controlling costs and strengthening compliance. It is designed for organizations struggling with sprawling app usage, rising SaaS spend, and unmanaged access risks.
When it comes to cloud infrastructure monitoring, CloudEagle.ai extends beyond procurement by offering deep insights into SaaS applications, usage, and access patterns.
It improves the security of SaaS apps by identifying shadow IT, flagging risky user access, and ensuring only the right people have permissions. This positions CloudEagle as not just a buying platform, but a critical layer of protection and optimization across the cloud stack.
Key Features
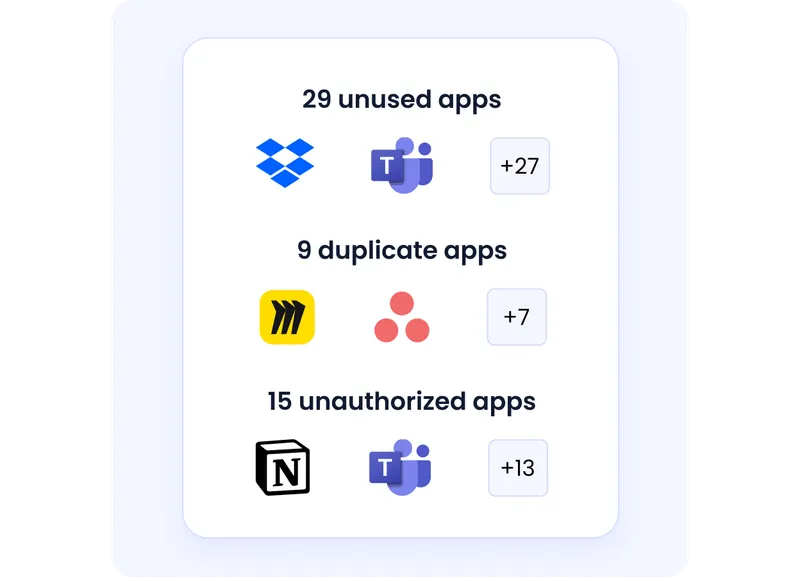
Tackle shadow IT before it hurts you
Unapproved SaaS apps often slip into the environment unnoticed, creating hidden risks. CloudEagle detects these shadow apps early, giving teams the visibility to secure them before they become a liability.
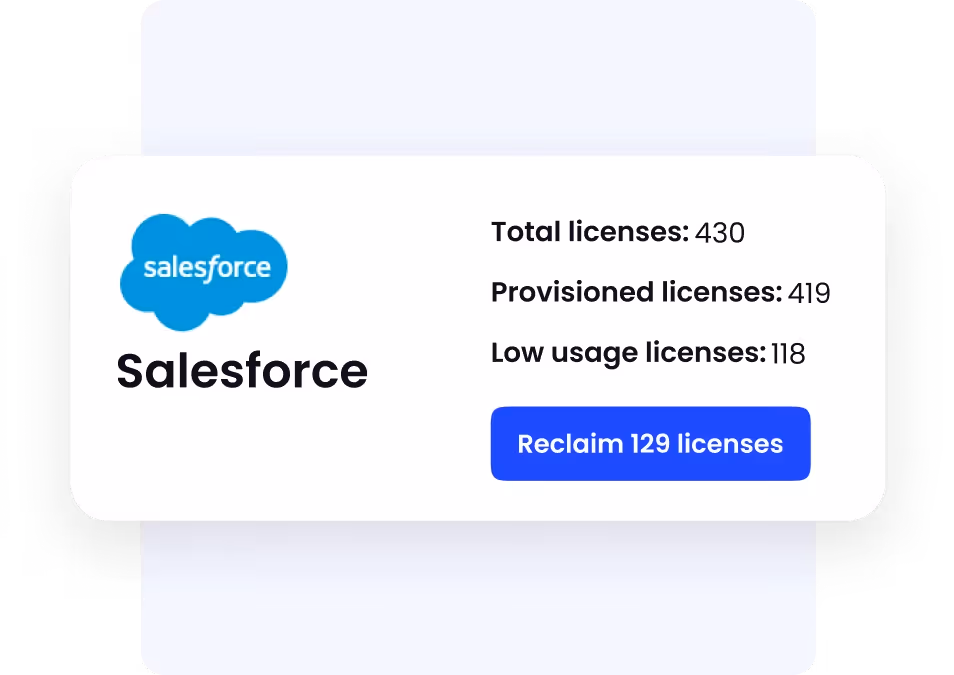
Stop paying for licenses nobody uses
Unused or underutilized licenses silently eat into budgets. CloudEagle highlights inactive accounts and redundant subscriptions, so organizations can cut waste and reallocate spend where it delivers real value.
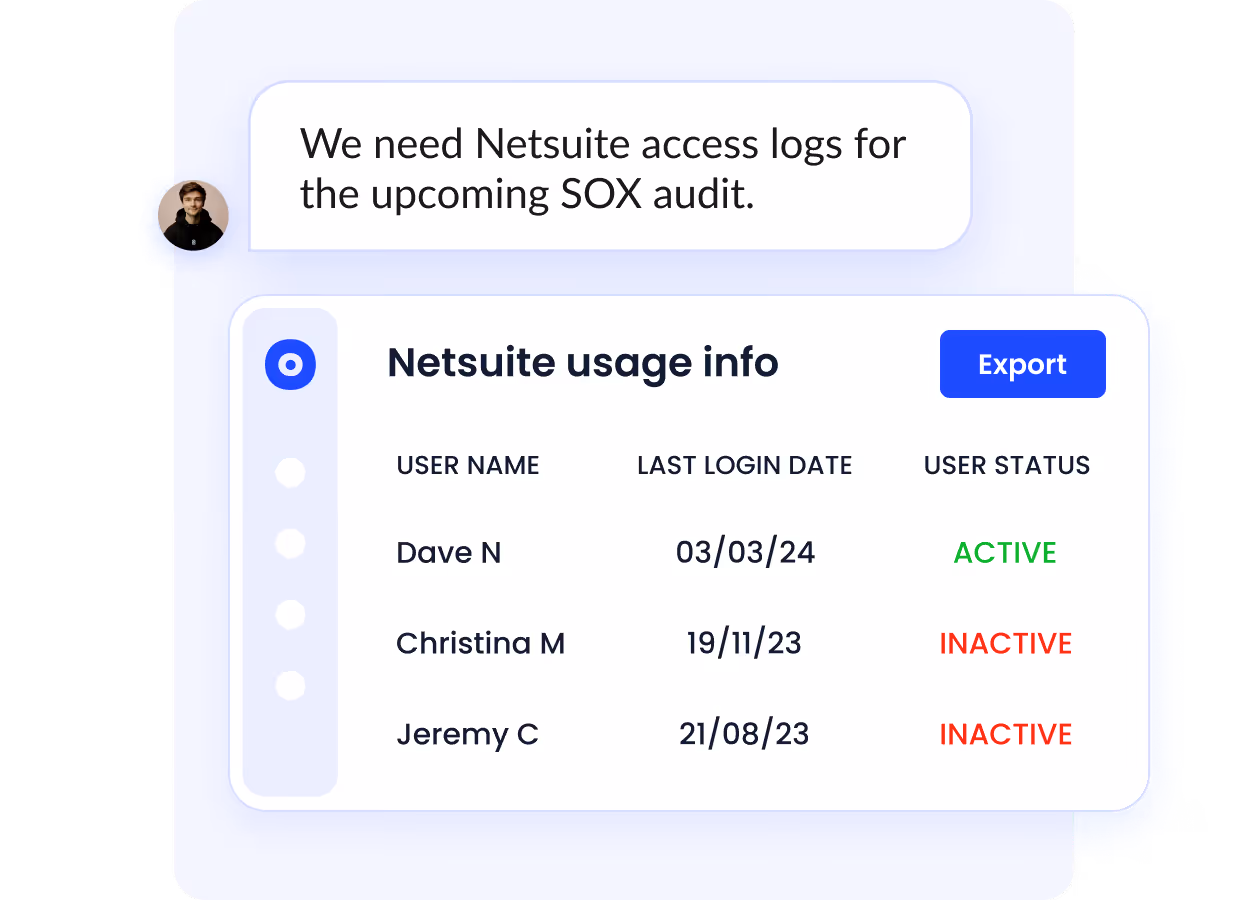
Simplify access reviews and compliance
Staying audit-ready is tough when you’re juggling dozens of apps. CloudEagle automates access reviews, helps enforce least privilege, and generates audit reports, reducing compliance headaches while strengthening governance.
Stay ahead of renewals without fire drills
Missed renewals often lead to surprise costs or service gaps. With proactive renewal alerts and workflow automation, CloudEagle keeps teams prepared, ensuring no contract slips through the cracks.
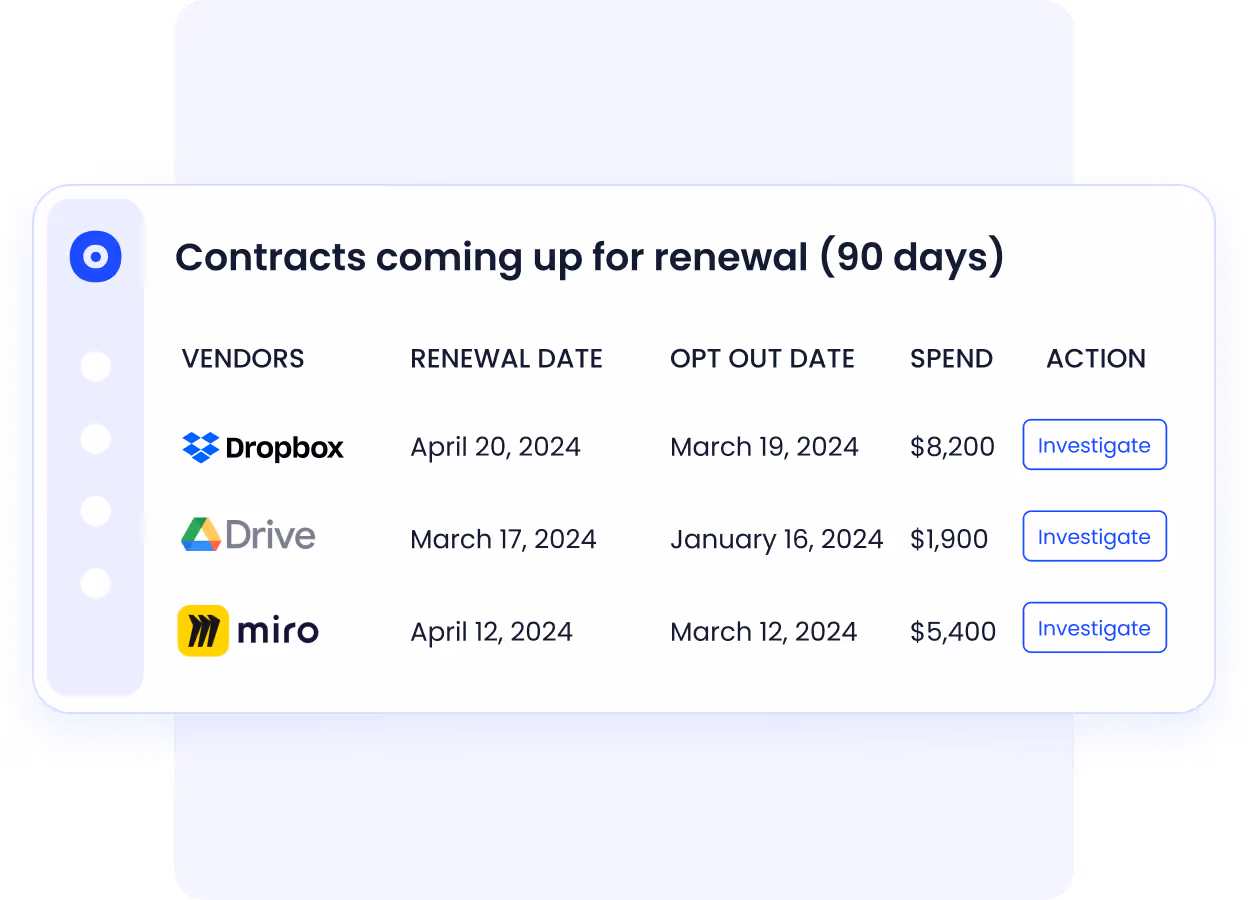
Falkonry, for example, struggled with auto-renewals and app downtime caused by missed deadlines. CloudEagle’s automated workflows and 90-day reminders helped them save $401,200+, prevent downtime, and cut thousands of hours in manual contract management.
"As our software portfolio expanded, staying ahead of every contract renewal became increasingly important for cost control and operational continuity. CloudEagle.ai gave us 90-day renewal visibility, eliminated auto-renewals, and helped reduce contract management time by 80%, saving 1,350 hours annually. That shift gave our team complete control over renewals without disrupting access to critical tools."
- Pratibha Mehta, Head of Operations, Falkonry
Pros
- Full visibility into SaaS usage and costs.
- Strong governance features for compliance and audits.
- Automated workflows that reduce manual effort.
- Proactive alerts for renewals and cost optimization.
Pricing
CloudEagle.ai operates on a tailored pricing model. Request a quote to get a plan aligned with your organization’s size and needs.
Control Every Identity. Eliminate Access Risk.


2. New Relic
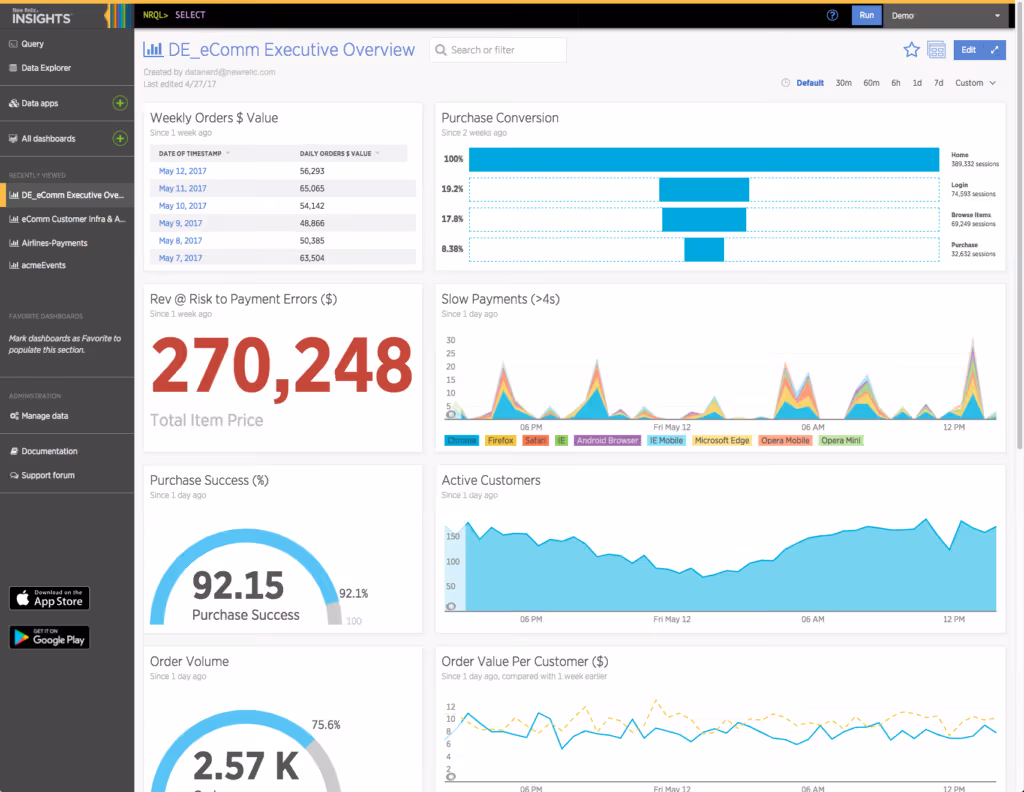
New Relic is a unified cloud infrastructure monitoring platform and observability suite. It brings metrics, logs, traces, RUM, and synthetics into one place with a secure telemetry cloud, powerful analysis tools, and wide integrations, built for fast troubleshooting and data-driven decisions. Among cloud infrastructure monitoring platforms, New Relic stands out for NRQL flexibility and a generous free tier.
Key Features
- Full-Stack Observability: APM, infrastructure, logs, RUM, and synthetics in one platform.
- Unified Telemetry Cloud: Centralize metrics/events/logs/traces with fast query and analysis.
- AI-Assisted Insights: NLQ/Grok and ML-driven alerting to accelerate root cause analysis.
- NRQL + Custom Dashboards: Flexible querying and visualizations for teams and leaders.
- Ecosystem Integrations: 700+ integrations (AWS, Azure, GCP, Kafka, Slack, more).
Pros
- Strong APM with code-level traces and real-time insights.
- Clean dashboards; easy correlation across logs/metrics/traces.
- Generous free tier and predictable usage-based model.
Cons
- Costs can rise with higher data ingestion and advanced features.
- Set up/onboarding and some integrations feel complex for newcomers.
- UI depth creates a learning curve for non-experts.
Pricing
- Free (forever): 100 GB/month data ingest, unlimited basic/core users, 1 free full-platform user.
- Standard: Pay-as-you-go; up to 5 full users; ~$0.40/GB beyond free 100 GB.
- Pro: Unlimited full users; commitment options; ~$0.40/GB; advanced support.
- Enterprise: Custom; advanced security/compliance (Data Plus ~$0.60/GB), priority SLAs.
- Notes: Unlimited hosts/CPUs; optional compute add-ons; discounts for volume/commit.
3. Amazon CloudWatch
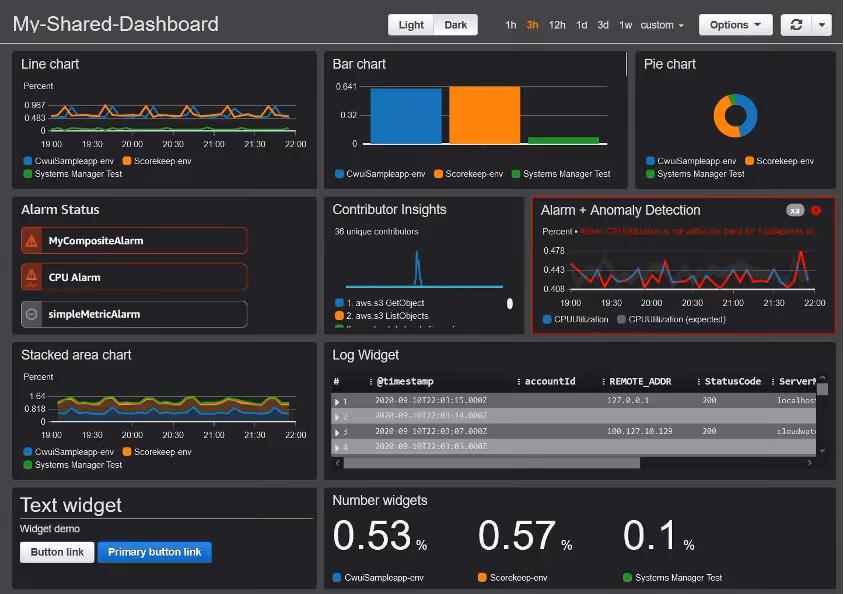
Amazon CloudWatch is AWS’s native cloud infrastructure monitoring platform for resources and applications running on AWS. It centralizes metrics, logs, traces, dashboards, and alarms to deliver real-time visibility and automation across EC2, Lambda, RDS, EKS, and more.
Key Features
- Native AWS Coverage: Automatic metrics for most AWS services; hooks to SNS, Auto Scaling, and Lambda for automated responses.
- Logs & Insights: Centralized log ingestion, Live Tail, and SQL-like queries with Logs Insights.
- Alarms & Anomalies: Threshold/composite alarms, metric math, and anomaly detection for proactive alerting.
- Dashboards: Customizable widgets and team-specific views for performance and cost signals.
- Custom Metrics: Publish app-level metrics and correlate with infrastructure signals.
Pros
- Deep, seamless integration across the AWS ecosystem.
- Real-time monitoring with robust alerting and automation workflows.
- Unified dashboards for infra and app teams; quick to enable on AWS.
Cons
- Costs can rise quickly with high log ingestion or custom metrics.
- Limited cross-cloud visibility compared to third-party tools.
- Learning curve and less flexible dashboards than Grafana/Kibana per users.
Pricing
- Free tier: Basic AWS service metrics, 5 GB logs, 3 custom dashboards, 10 standard alarms, 1M API requests, 100k X-Ray traces (per month).
- Paid: Pay-as-you-go for metrics, log ingest/storage, queries, dashboards, alarms, and API calls; rates vary by region. Use the AWS Pricing Calculator or request a quote.
4. Microsoft Azure Monitor
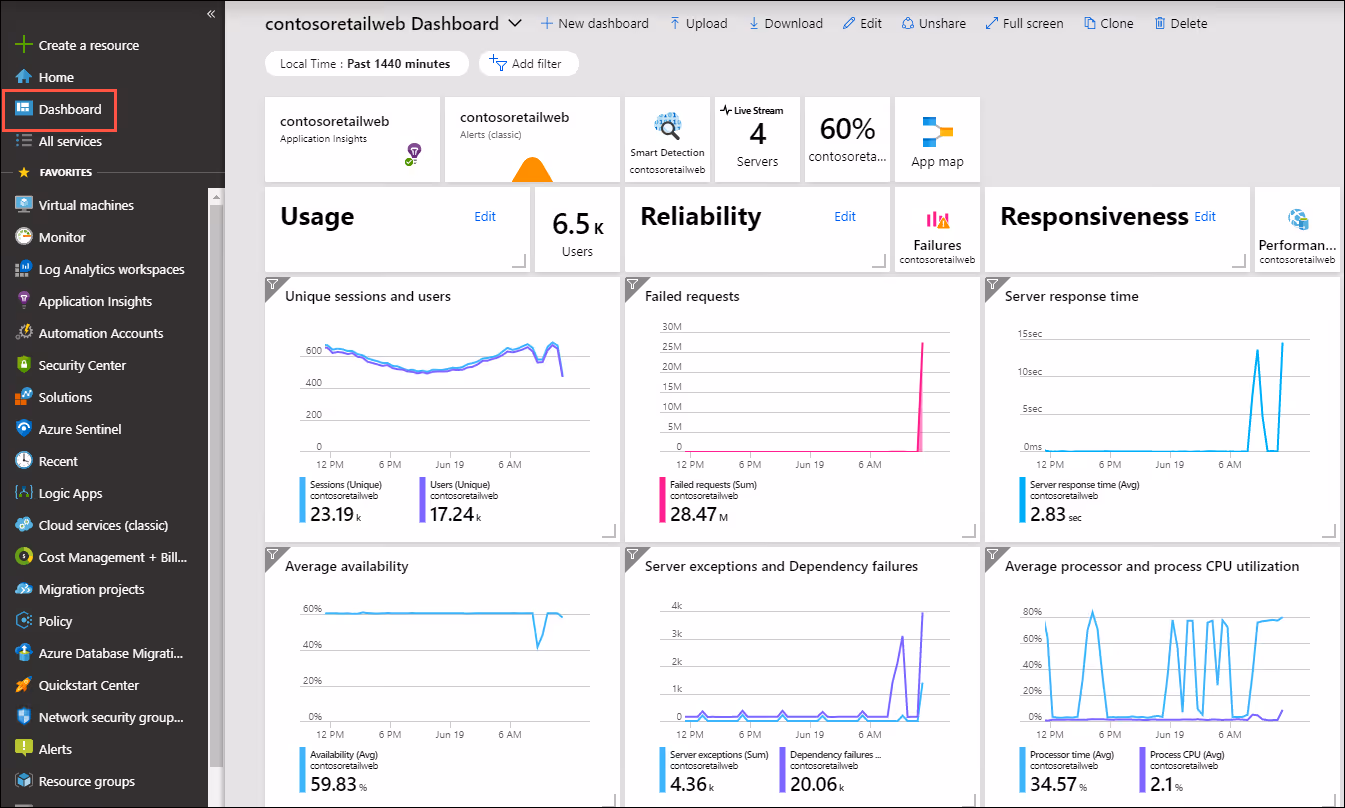
Azure Monitor is Microsoft’s native cloud infrastructure monitoring platform for Azure. It unifies metrics, logs, traces, alerts, and dashboards, plus Application Insights, so teams can observe apps, infrastructure, and networks in one place, troubleshoot faster, and keep services performing reliably at scale.
Key Features
- Full-Stack Coverage: Metrics, logs, traces, RUM, synthetics, and platform health across Azure resources.
- KQL & Workbooks: Powerful Kusto Query Language, analytics, and customizable Workbooks/dashboards.
- Smart Alerts: Dynamic thresholds, action groups, and automation for proactive incident response.
- Deep Azure Integration: Native signals for VM/AKS/App Services, Activity Logs, and platform diagnostics.
- Log Analytics: Flexible tables and tiers for cost control, with fast query performance.
Pros
- Seamless integration across Azure services and resource types.
- Strong analytics with KQL and versatile Workbooks.
- Centralized observability that scales with Azure estates.
Cons
- Pricing and tiers can feel complex to estimate.
- Costs can rise with high log ingestion/retention.
- UI depth and setup create a learning curve.
Pricing
- Usage-based. Standard metrics/activity logs are free; pay for logs ingestion, queries, retention, export, and alerts.
- Log tiers: Auxiliary ($0.05/GB), Basic ($0.50/GB), Analytics ($2.30/GB; first 5 GB/mo free; volume discounts).
- Retention: 30–31 days included (90 with Sentinel); beyond that, $0.10/GB-mo (interactive) or $0.02/GB-mo (long-term).
- Queries: $0.005/GB scanned for Basic/Aux; included for Analytics Logs.
- Export/Platform logs: up to $0.25/GB to Storage/Event Hub; region-based rates. Use the Azure Pricing Calculator or request a quote.
5. Google Cloud Operations Suite
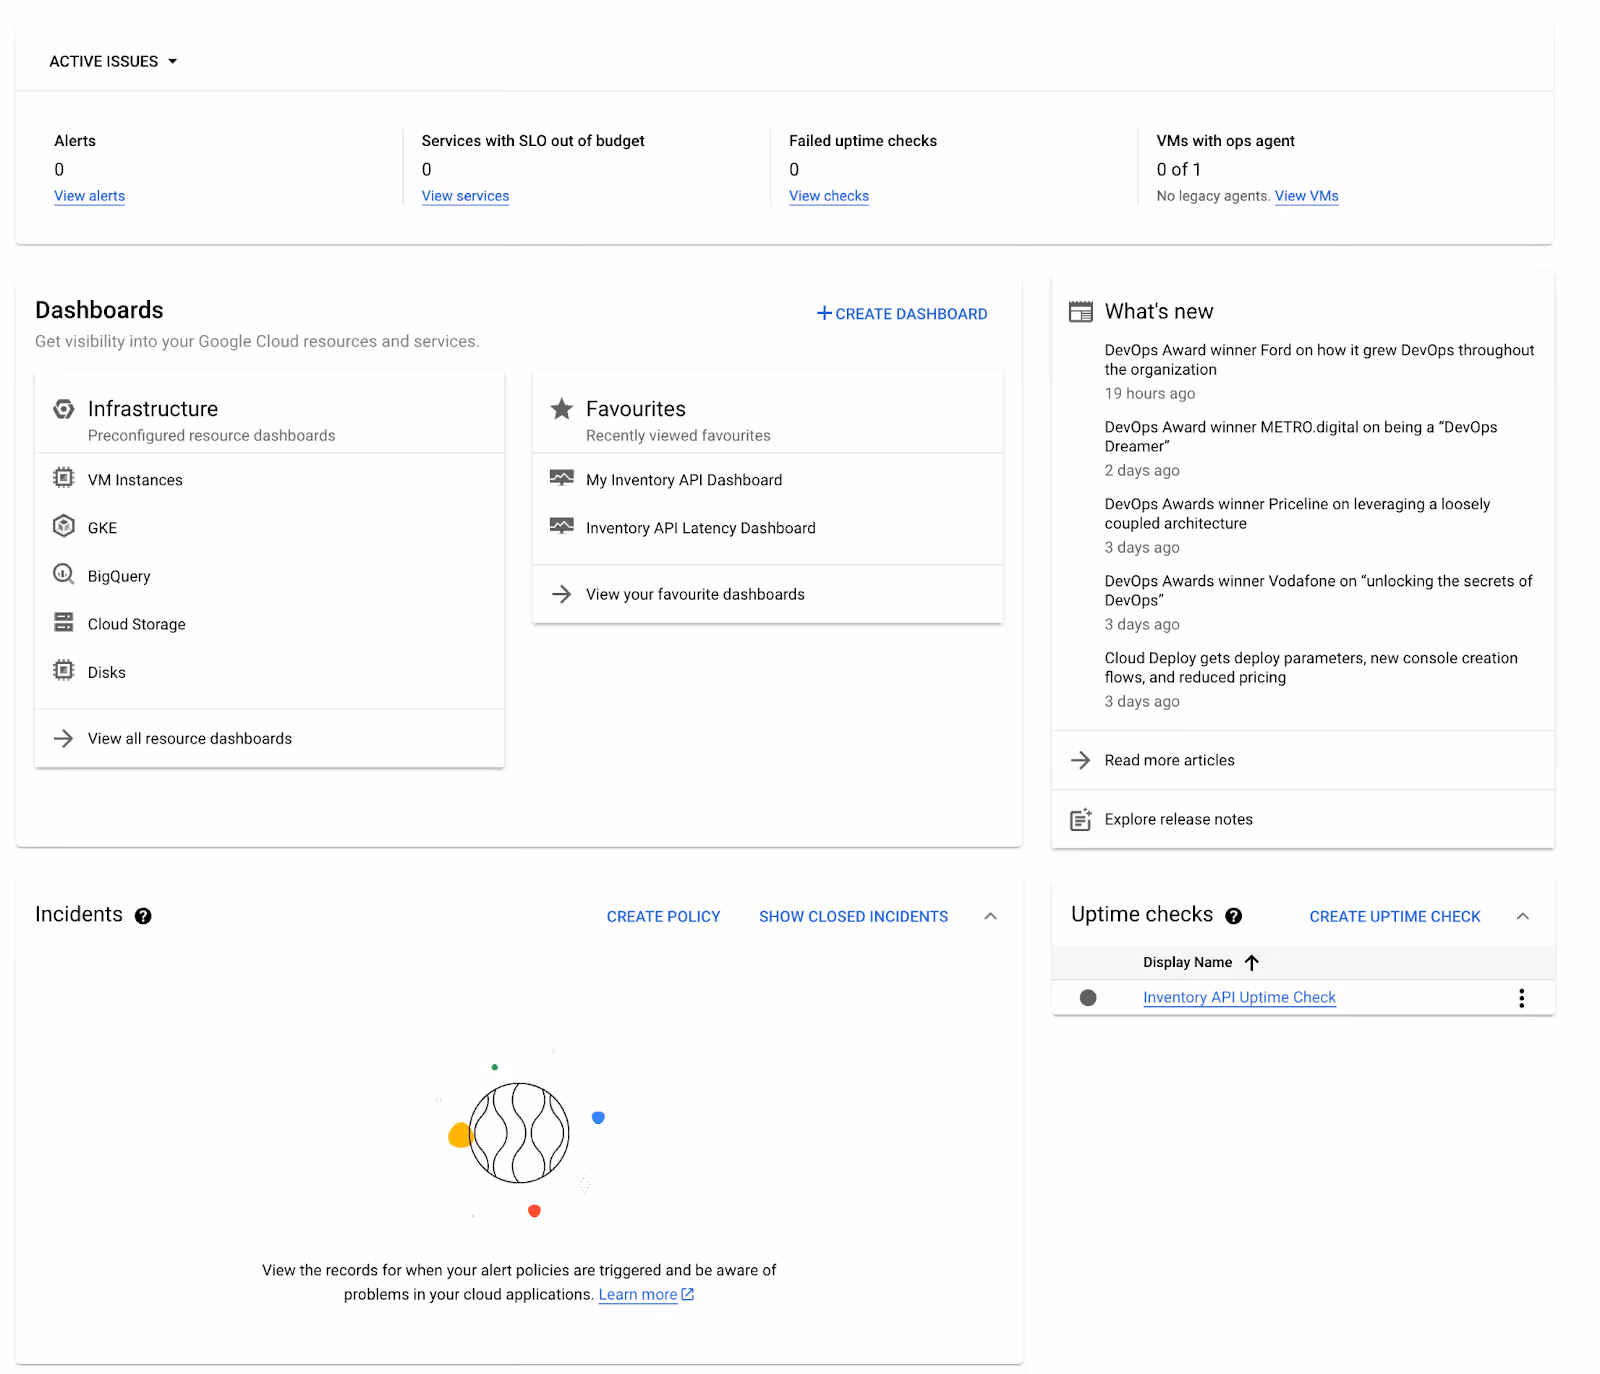
Google Cloud Operations Suite is Google’s native cloud infrastructure monitoring platform for GCP and hybrid/multicloud. It unifies Monitoring, Logging, Trace, Profiler, Error Reporting, and Debugger to deliver end-to-end observability, faster troubleshooting, and reliable performance.
Key Features
- Monitoring & Dashboards: Time-series metrics, SLOs, uptime checks, and flexible dashboards with alerting to Slack, PagerDuty, email, and more.
- Cloud Logging & Analytics: Centralized logs, Log Analytics (SQL-style queries), log-based metrics, and export to BigQuery/Cloud Storage/Pub/Sub.
- Tracing, Errors & Debugging: Cloud Trace (latency analysis), Error Reporting (auto-grouped exceptions), Profiler (CPU/memory hot spots), and Debugger (prod snapshots).
- Managed Prometheus: Fully managed ingestion and alerting compatible with PromQL; tight GKE/Kubernetes integration.
- Hybrid & Multicloud Support: Agents and integrations for GCP, AWS, and on-prem workloads.
Pros
- Deep, native integration across Google Cloud services.
- Strong developer tooling (Profiler, Debugger, Error Reporting) accelerates fixes.
- Generous free allotments ease adoption.
Cons
- Pricing model can be complex (bytes vs. samples, retention).
- UI depth and configuration create a learning curve.
- GCP-first experience; cross-cloud visibility requires extra setup.
Pricing
- Cloud Logging: First 50 GiB/project free; then $0.50/GiB; retention beyond 30 days $0.01/GiB-mo.
- Cloud Monitoring: First 150 MiB free; tiered at $0.258/MiB then lower tiers; uptime checks $0.30/1,000; synthetic monitors $1.20/1,000.
- Managed Prometheus: From $0.06 per million samples (tiered).
- Cloud Trace: $0.20/million spans; first 2.5M spans free.
- Usage-based, no upfront fees; estimate in the Google Cloud Pricing Calculator or request a custom quote.
6. Prometheus + Grafana
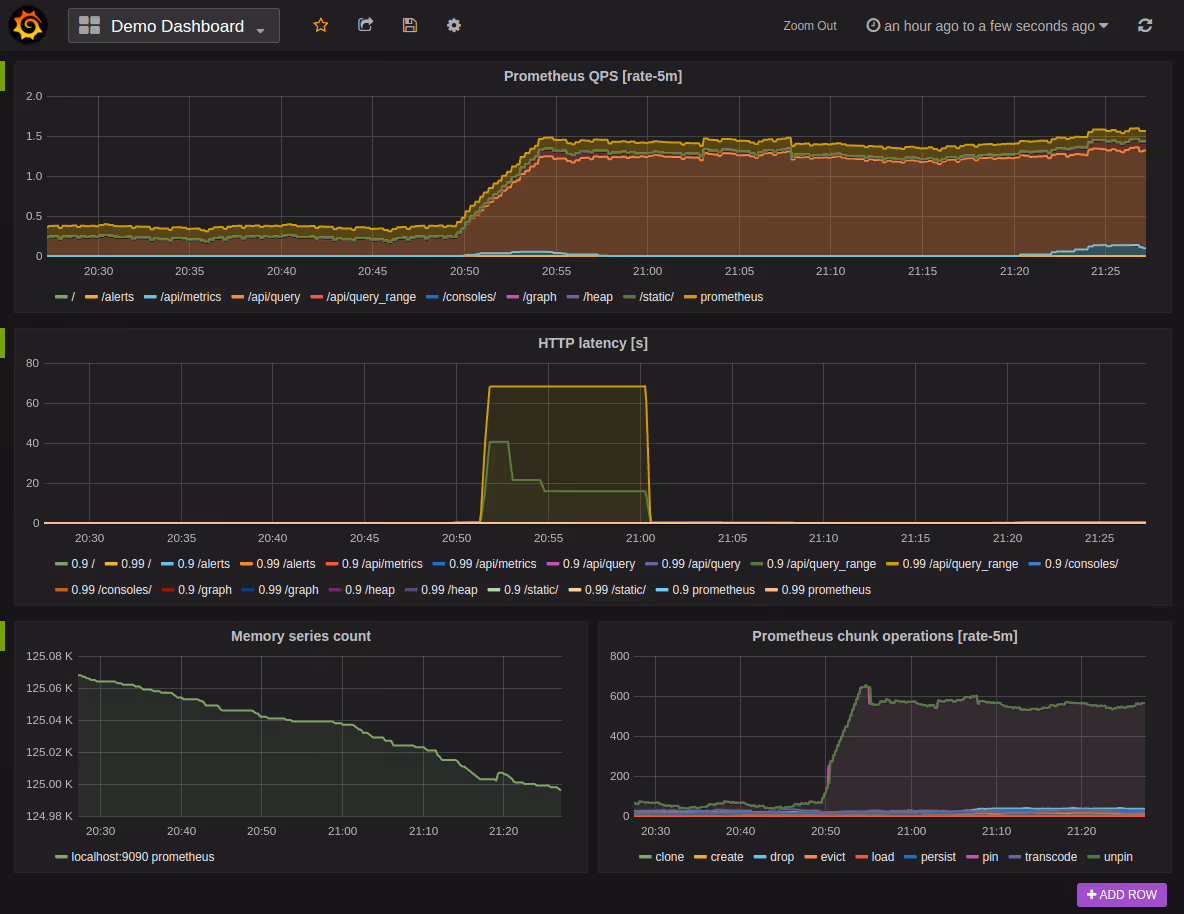
Prometheus + Grafana is the open-source cloud infrastructure monitoring platform combo: Prometheus scrapes and stores time-series metrics with powerful PromQL queries and alerting, while Grafana visualizes everything with rich dashboards. Ideal for Kubernetes, microservices, and cost-controlled, DIY observability.
For teams favoring open source, this duo ranks high among cloud infrastructure monitoring platforms for Kubernetes.
Key Features
- Pull-based Metrics & PromQL: Efficient scraping, labels, and advanced queries for precise SLO/SLA tracking.
- Alertmanager: Flexible routing, silencing, deduplication, and integrations (Slack, PagerDuty, webhooks).
- Grafana Dashboards: Beautiful, shareable visualizations and alerts across mixed data sources.
- Kubernetes-Native: Easy discovery of pods/nodes via service discovery; huge library of exporters.
- Scalable Storage Options: Remote write to long-term backends (e.g., Grafana Mimir/Cortex/Thanos) for retention.
Pros
- Open source, flexible, and widely adopted in cloud-native stacks.
- Excellent for real-time metrics and Kubernetes monitoring.
- Massive ecosystem of exporters, dashboards, and community knowledge.
Cons
- Learning curve with PromQL and alerting conventions.
- Long-term retention and scale require extra components/ops effort.
- Logs/traces not included by default; need additional tools/services.
Pricing
- Prometheus & Grafana OSS: No license fees; pay your own infra/storage/ops.
- Grafana Cloud (managed): Free tier; Pro from $19/month + usage. Metrics $6.50/1k series; Logs/Traces/Profiles $0.50/GB; Kubernetes Monitoring from $0.015/host-hour. Enterprise starts at $25K/year (commit).
7. LogicMonitor
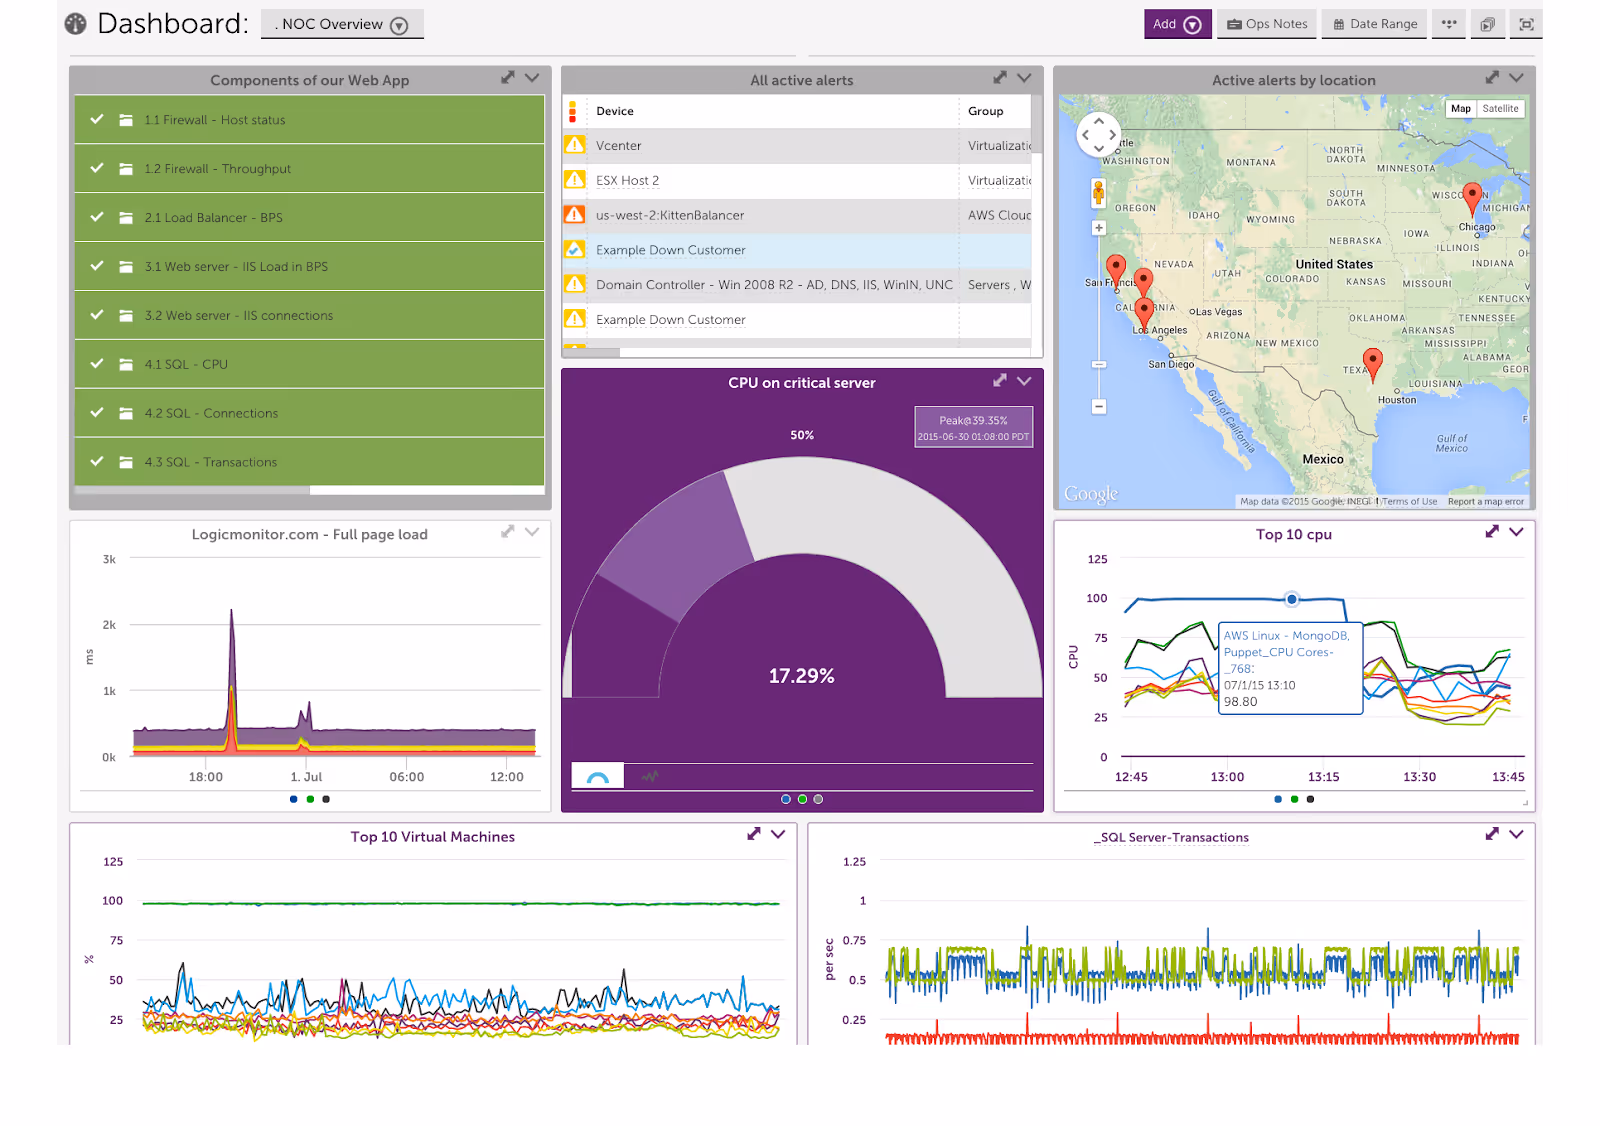
LogicMonitor (LM Envision) is a SaaS, AI-assisted cloud infrastructure monitoring platform for hybrid and multicloud estates. With agentless collectors, deep integrations, and log intelligence, it unifies metrics, logs, and topology to cut MTTR and improve service reliability at scale. For MSPs comparing cloud infrastructure monitoring platforms, LM’s agentless discovery is compelling.
Key Features
- Hybrid visibility & discovery: Auto-discovers servers, networks, cloud IaaS/PaaS, and containers, normalizing metrics into unified dashboards and topology maps for faster impact analysis.
- AI-assisted alerting: Noise reduction, correlation, and dynamic thresholds surface actionable incidents; on-call via voice/SMS and ITSM ticket automations.
- Extensible data collection: Polls SNMP/APIs, supports custom DataSources and open integrations to monitor niche systems without agents.
- Log intelligence: Correlates logs with infrastructure signals to accelerate root-cause analysis and reduce manual triage.
- Cloud & SaaS monitoring: Deep AWS/Azure/GCP coverage plus digital experience (synthetics) and SaaS app health.
Pros
- Broad, agentless coverage across on-prem and multicloud with strong integrations.
- Highly extensible (APIs, custom DataSources) to fit unique environments.
- Practical operations workflow: dashboards, ITSM ties, and on-call notifications.
Cons
- Pricing can feel high as resource counts grow.
- UI transitions and depth introduce a learning curve; alert tuning required.
- APM/tracing features are improving but less mature than specialist tools.
Pricing
- Infrastructure monitoring: $22/resource/month (billed annually; volume discounts).
- Cloud IaaS monitoring: $22/resource/month.
- Cloud PaaS & containers: $3/resource/month.
- Wireless APs: $4/resource/month.
- Log Intelligence retention: $2.50/GB (7d), $4/GB (30d), $5.50/GB (90d), $7/GB (1yr).
- Add-ons include synthetics, traces, SaaS monitoring, cost optimization. Free trial available; request a quote for enterprise tiers.
8. Site24x7
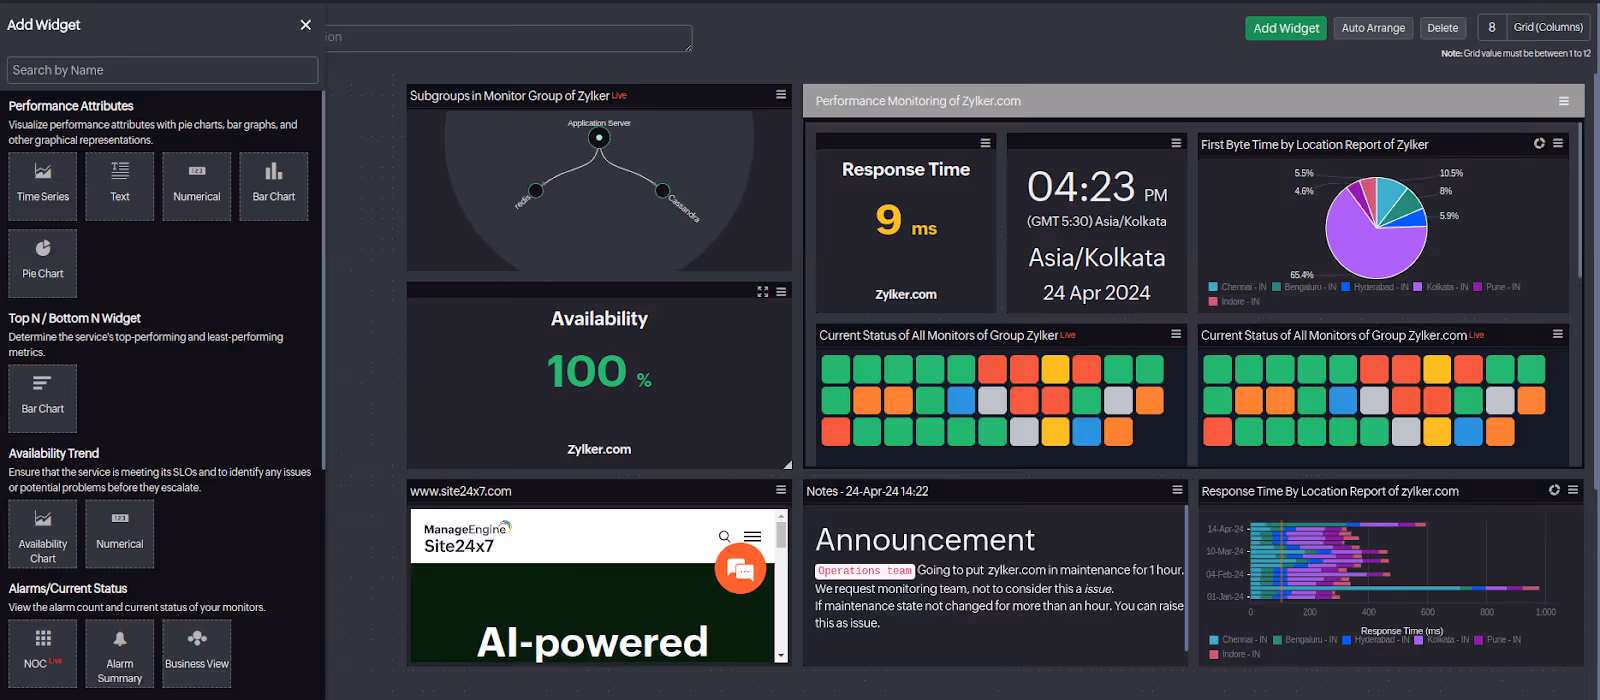
Site24x7 is an all-in-one, cloud-hosted observability platform for websites, apps, servers, networks, and public clouds. It combines uptime checks, synthetics, APM, RUM, logs, and infra monitoring with 100+ global test locations, MSP-friendly multi-tenant management, and rich alerting integrations.
Key features
- Website uptime & synthetic transactions from 100+ locations
- APM + Real User Monitoring (RUM) with waterfall and page insights
- Server, VM, network device, and cloud (AWS/Azure/GCP) monitoring
- AI-assisted alerting, RCA reports, and ITSM/chatops integrations (Opsgenie, PagerDuty, Slack, Teams, Jira, etc.)
- Mobile app for on-the-go incident triage
Pros
- Quick setup with broad coverage across web, infra, and cloud
- Strong integrations and multi-tenant MSP capabilities
- Useful RCA, dashboards, and real-time notifications
Cons
- UI can feel busy; learning curve for new users
- Pricing can rise with many monitors/add-ons
- Alert tuning and some advanced customizations need effort
Pricing
- Free (personal).
- Starter: $9/mo: ~11 monitors (1-min polling), basic RUM/logs.
- Pro: $35/mo: ~43 monitors; more synthetics/RUM.
- MSP: $45/mo: ~53 monitors; multi-tenant.
- Classic: $89/mo: ~105 monitors.
- Elite: $225/mo: ~260 monitors.
- 30-day free trial; credit card/PO/PayPal options. RUM pageviews and log GBs included vary by tier.
9. Splunk AppDynamics
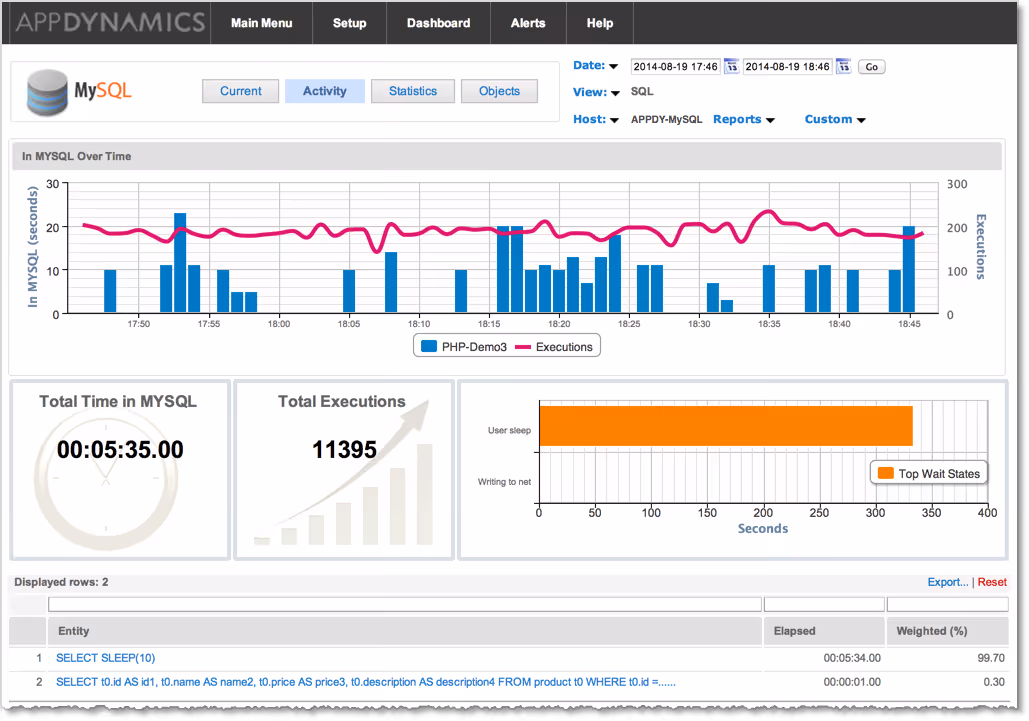
Splunk AppDynamics (by Cisco) is an enterprise APM/observability platform that maps business transactions end-to-end across apps, infrastructure, databases, and networks. It delivers code-level diagnostics, baselines, AI-assisted alerts, and digital experience monitoring to cut MTTR and tie performance to business impact.
Key features
- Business Transaction & service flow maps with code-level tracing
- AI baselining, anomaly detection, and health rules/alerts
- Digital Experience Monitoring (RUM/Mobile/Browser) + synthetics
- Infrastructure, database, and multi-cloud monitoring with ITSM integrations
- Business IQ–style analytics linking technical issues to KPIs
Pros
- Deep, context-rich visibility from user to code and DB
- Strong out-of-the-box transaction detection and dashboards
- Mature ecosystem/integrations (ServiceNow, cloud providers, etc.)
Cons
- Pricing can be high at scale
- Learning curve; UI/workflows can feel complex for newcomers
- Agent upgrades/maintenance can require manual effort
Pricing
- Starts at ~$6 per month per CPU core (billed annually).
- Editions: APM Pro (free trial), APM Advanced, APM Peak (quote-based).
- Add-ons/coverage: DEM (RUM/MRUM/BRUM), SAP monitoring, security/runtime protection, infra & DB monitoring.
- Enterprise quotes and volume discounts available.
10. Datadog
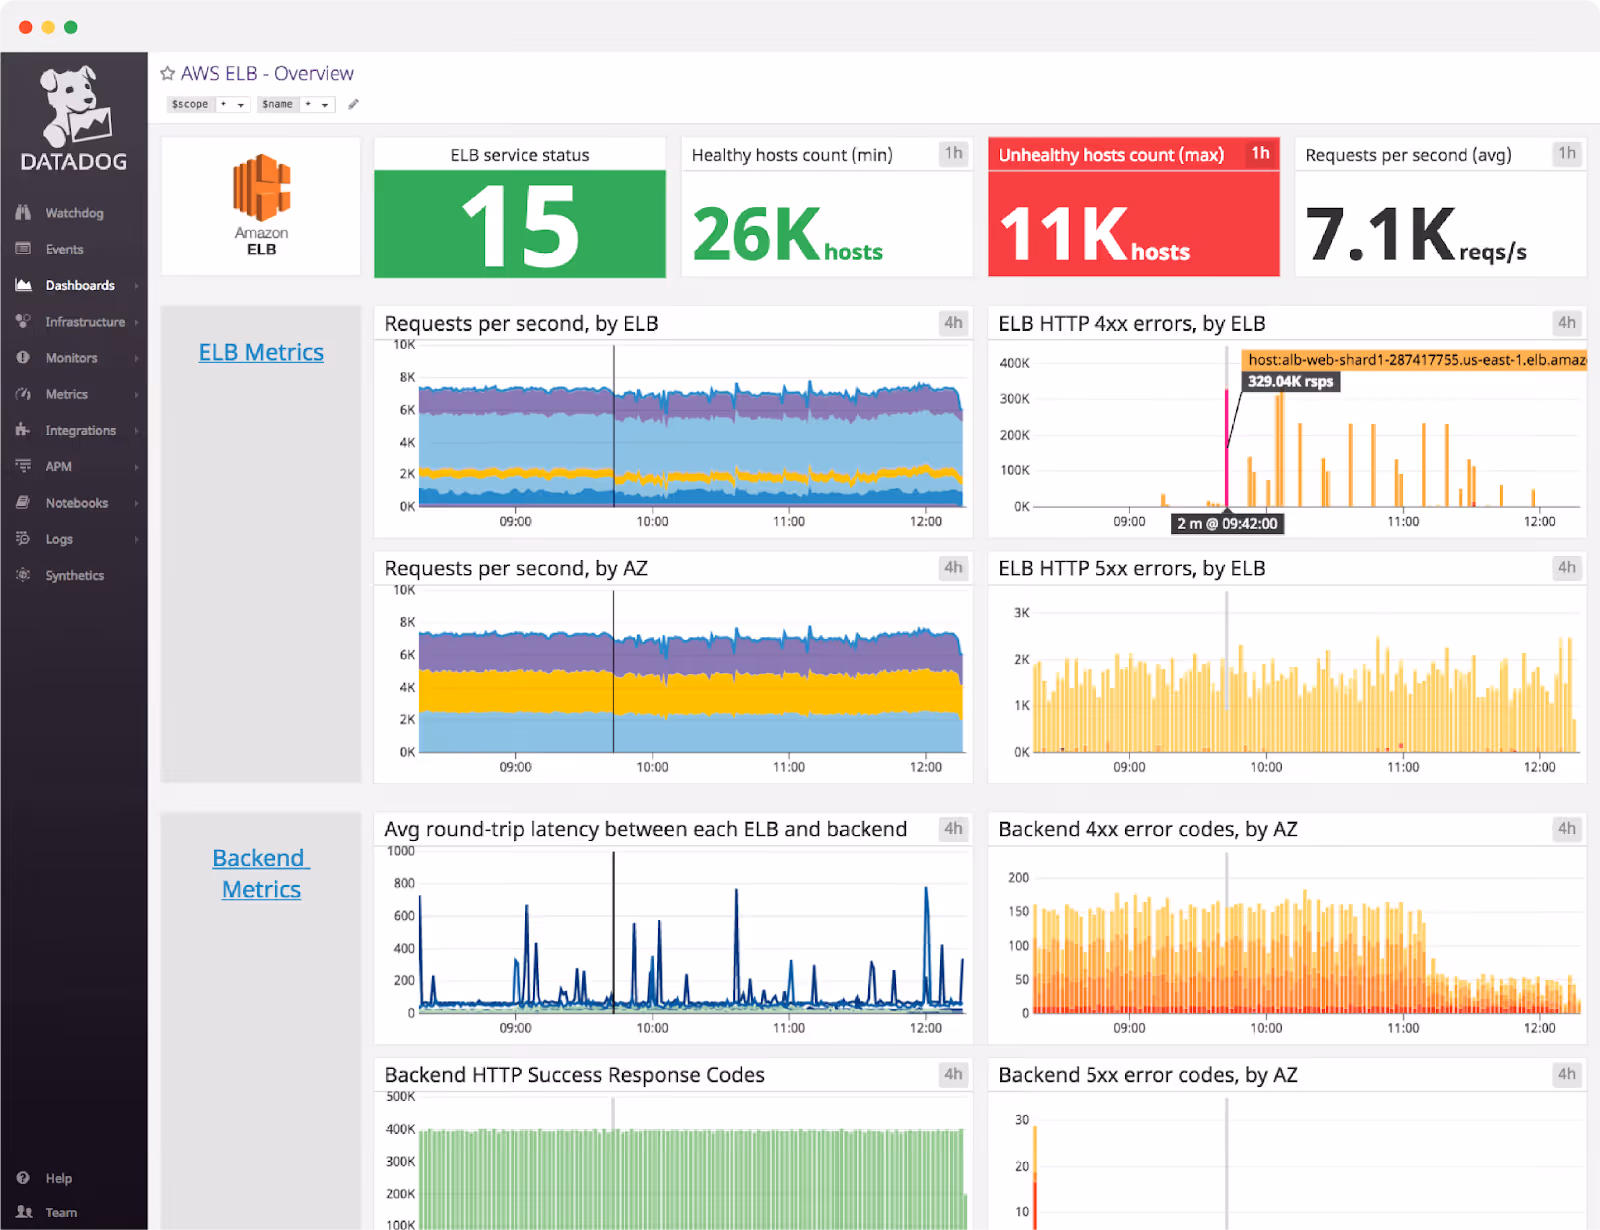
Datadog is a leading cloud infrastructure monitoring platform that unifies infrastructure monitoring, application performance, log management, and security into one solution. It gives organizations real-time visibility across their entire stack, making it easier to detect issues, optimize resources, and improve reliability at scale.
Key Features
- Unified Observability: Combine metrics, logs, and traces into one dashboard for faster root cause analysis.
- 900+ Integrations: Out-of-the-box support for AWS, Azure, Kubernetes, Slack, PagerDuty, and more.
- Real-Time Monitoring: Track CPU, memory, containers, and network usage with instant alerts.
- Machine Learning Alerts: Use anomaly detection and forecasting to spot unusual behavior before it impacts users.
- Custom Dashboards: Build tailored visualizations to track key business and technical KPIs.
Pros
- Seamless integrations with popular cloud platforms and services.
- Real-time visibility into performance and security.
- Flexible dashboards that are both powerful and intuitive.
Cons
- Pricing can escalate quickly as usage scales.
- Steep learning curve for new users due to feature depth.
- Some users report the interface can feel cluttered.
Pricing
- Free Plan: $0/month (up to 5 hosts, 1-day metric retention).
- Pro Plan: Starts at $15 per host/month (900+ integrations, 15-month retention).
- Enterprise Plan: Starts at $23 per host/month with advanced admin features and ML-based alerts.
- DevSecOps Plans: From $22 per host/month, adding security and compliance monitoring.
6. Open-Source Cloud Monitoring Tools
- Complete Open-Source Stack: While Prometheus and Grafana form the base of cloud infrastructure monitoring, full visibility requires adding Loki for logs, Tempo for tracing, and Thanos or Mimir for long-term data retention.
- Kubernetes-Native Monitoring: These tools excel in Kubernetes environments, leveraging service discovery and Helm charts to quickly establish golden-signal dashboards.
- Total Cost of Ownership: Open-source solutions eliminate license fees but increase operational burden, requiring manual effort for storage scaling, cardinality tuning, and security RBAC configuration.
- Strategic Selection Criteria:
- Cost: Open-source delivers the best unit economics for teams with high platform engineering capacity.
- Security: Managed platforms reduce compliance risk with built-in SOC 2 controls and audit logging.
- Efficiency: Managed options are superior for reducing IT workload and eliminating manual alert threshold tuning.
7. When Open-Source Cloud Monitoring Tools Make Sense (and When They Don’t)?
Select cloud infrastructure monitoring software based on time-to-value, alert noise, and pricing predictability rather than aggregate star ratings.
- Prioritize reviews from enterprise buyers using similar tech stacks, such as Kubernetes, hybrid cloud, or AWS-only environments.
- Verify critical features like native OpenTelemetry support, multi-cloud depth, and granular RBAC.
- Stress-test tools during trials by simulating CPU spikes or 5xx errors to validate alert routing and RTO.
- Ensure observability portability by testing dashboards-as-code via Terraform or Grafana JSON.
- Analyze the top cloud monitoring tools through specific stakeholder lenses to finalize your shortlist.
8. Key Requirements for Monitoring Cloud Apps and Infrastructure
Before shortlisting any cloud monitoring platform, validate it against these seven non-negotiable requirements.
Each maps directly to one of the three operational decision drivers Cost, Security, or IT Workload, so every stakeholder can apply the checklist through their own lens.
10. Turn Monitoring Insights Into Cost Savings and Governance Control With CloudEagle.ai
You now know what great cloud monitoring looks like and how to test it. Before SaaS sprawl and surprise renewals creep in, lock the wins with a simple selection and governance playbook:
Evaluate in production-like conditions, Design for multi-cloud reality, Tame noise early, Control cost from day zero
Lock in the gains from your cloud infrastructure monitoring platforms with tight governance and cost controls. Ready to shortlist and negotiate?
CloudEagle.ai centralizes vendor discovery, benchmarks pricing, tracks usage, automates renewals, and negotiates on your behalf, so you get the right toolset without surprise bills.
FAQs
1. What are examples of cloud infrastructure?
Examples of cloud infrastructure include compute (VMs, containers, serverless), storage (object, block, file), networking (VPCs, load balancers, CDNs), databases, identity & access, and observability/security services from providers like AWS, Azure, and Google Cloud.
2. Which tool is used for monitoring cloud environment infrastructure?
Common tools: AWS CloudWatch, Azure Monitor, Google Cloud Operations Suite, Datadog, New Relic, Prometheus + Grafana, LogicMonitor, and Site24x7. Pick based on stack, scale, budget, and required integrations.
3. What are the four 4 cloud infrastructure services?
The four core IaaS service pillars: compute (VMs/containers), storage (object/block/file), networking (VPCs, load balancers), and security/identity (IAM, keys, policies).
4. What are the three parts of cloud monitoring?
Three parts (observability pillars): metrics (quantitative signals), logs (event records), and traces (distributed request paths). Many teams add uptime checks and events, but M-L-T are the foundation.
5. What is the difference between application monitoring and infrastructure monitoring?
Application monitoring tracks code-level transactions, dependencies, errors, and end-user experience (APM/RUM). Infrastructure monitoring tracks the health and capacity of hosts, containers, networks, and cloud services (CPU, memory, I/O, availability).
6. What are the 7 components of IT infrastructure?
Seven components: compute (servers/endpoints), networking (LAN/WAN/Internet), storage & databases, virtualization/cloud platforms, operating systems & middleware, security & identity (IAM, keys), and facilities/physical layer (power, cooling) with management/backup tooling.


.avif)


.avif)
.avif)


.png)