.avif)
%201.svg)


HIPAA Compliance Checklist for 2025

You’re tracking growth. But is it the right kind of growth?
Revenue might be up, but margins are shrinking. Customer signups are climbing, but retention is sliding. The numbers look good until they don’t.
This is where SaaS benchmarking helps. It gives clear context to your performance and shows what needs fixing. In this guide, you’ll learn what to measure, how to measure it, and how to use benchmarks to improve growth, efficiency, and smarter decision-making.
What is SaaS Benchmarking?
SaaS benchmarking is how companies figure out whether their performance is actually good or just looks good in isolation.
It means comparing your metrics, like growth, churn, or revenue per user, against industry averages or historical internal data. You’re not just watching your own numbers move. You’re checking if they mean something in the broader SaaS context.
Let’s say your customer churn rate is 7%. Is that bad? Depends. If your peers in the same revenue range are at 3%, you’ve got a problem. But if you’re outperforming a median churn of 10%, you’re in a solid spot. That’s the power of benchmarking; it gives you a frame of reference.
Why Do You Need to Consider SaaS Benchmarks?
The B2B SaaS benchmarks help you measure your performance against industry standards so you can find out what’s working and what’s not.
They give you clear context for your metrics. Instead of just watching your numbers move, you get to compare them with what’s typical across the industry. That’s how you spot gaps, set realistic targets, and course-correct before problems get expensive.
Here’s how benchmarks guide smarter decisions and drive growth:
1. They show you where you stand
Benchmarks reveal if your performance is above average, average, or lagging behind. That context helps you:
- Identify weak spots like high CAC or low retention
- Set meaningful goals based on actual data
- Focus your team on the right metrics
If your CAC payback is 18 months and your peers average 12, that’s a sign. Something needs fixing, whether it’s the sales cycle, pricing, or funnel quality.
2. They guide smarter decisions
SaaS benchmarks reduce guesswork. You’re not relying on instincts; you’re working with patterns that top SaaS companies already follow.
- Know where to invest first
- Justify spending with expected ROI
- Align teams with industry-backed KPIs
Leaders and investors take decisions more seriously when they're backed by benchmarking data.
3. They sharpen your competitive edge
SaaS benchmarks don’t just help you keep up. They help you stay ahead.
- See how pricing, packaging, or GTM models are shifting
- Benchmark sales comp or team efficiency to stay attractive
- Spot patterns others miss by zooming out
Bottom line: Benchmarks help you work smarter, not louder. They expose the gaps your gut can’t see.
Key SaaS Metrics to Benchmark
To benchmark effectively, you need to track the right metrics. These fall into four key groups: financial, customer, operational, and growth. Each tells a different part of the story, how well you're generating revenue, keeping customers, operating efficiently, and scaling.
1. Financial Metrics
These show how well your SaaS business earns and manages money.
a) Monthly Recurring Revenue (MRR)
This is the predictable income you earn each month from subscriptions. It helps track growth trends or early signs of churn.
Formula: MRR = Total active customers × Average revenue per account (ARPA)
b) Annual Recurring Revenue (ARR)
ARR gives a big-picture view of subscription revenue on an annual scale. It's vital for forecasting and growth planning.
Formula: ARR = MRR × 12
c) Gross Margin
This shows how much revenue you retain after service delivery costs. SaaS companies typically aim for 70–90%.
Formula: Gross Margin = (Revenue – COGS) / Revenue × 100
d) Customer Acquisition Cost (CAC)
CAC shows how much you spend to acquire a new customer. It’s a direct reflection of your marketing and sales efficiency.
Formula: CAC = Total Sales + Marketing Spend / Number of New Customers
e) Customer Lifetime Value (CLTV)
This metric shows how much revenue a customer is expected to generate during their relationship with you.
Formula: CLTV = ARPA × Customer lifetime (in months)
2. Customer Metrics
These track how engaged and loyal your users are, and how long they stick around.
a) Churn Rate
Shows what percentage of customers cancel during a given period. High churn = leaky bucket.
Formula: Churn Rate = Customers Lost / Customers at Start × 100
b) Net Revenue Retention (NRR)
This measures how much revenue you retain from existing customers, including upsells and downgrades.
Formula: NRR = (Starting MRR + Expansion – Contraction – Churn) / Starting MRR × 100
c) Customer Lifetime Value (CLTV) (retention view)
Beyond acquisition, CLTV tells you the long-term impact of customer satisfaction and loyalty. Useful for planning retention campaigns and supporting investment.
d) Net Promoter Score (NPS)
NPS gauges loyalty by asking customers how likely they are to recommend you. High scores signal happy users, low churn.
No formula; measured through surveys on a 0–10 scale.
3. Operational Metrics
These track internal efficiency, cost control, and growth sustainability.
a) Burn Multiple
Tells you how much you're spending for every $1 of new ARR. Lower is better.
Formula: Burn Multiple = Net Burn / Net New ARR
b) SaaS Magic Number
This shows sales efficiency. A number between 0.75 and 1.0 means balanced growth and spending.
Formula: (New ARR in current quarter – ARR in previous quarter) × 4 / Sales & Marketing Spend
c) Revenue per Employee
Helps measure operational efficiency as your team scales. Target range: $150K–$250K.
Formula: Total Revenue / Number of Employees
d) Rule of 40
Combines growth rate and profit margin. If the total is 40% or higher, your SaaS business is considered healthy.
Formula: Revenue Growth % + Profit Margin %
4. Growth Metrics
These show whether your business is moving in the right direction.
a) ARR Growth Rate
Measures the speed of your annual recurring revenue growth. For early-stage SaaS, 60%+ is solid.
Formula: (ARR Current – ARR Previous) / ARR Previous × 100
b) Trial-to-Paid Conversion Rate
Shows how effectively you’re turning free users into paying customers.
Formula: Paid Conversions / Number of Free Trials × 100
c) Expansion ARR
Tracks additional revenue from current customers via upsells or cross-sells. No fixed formula, usually tracked via CRM or billing data.
The takeaway: Don’t benchmark blindly. Focus on the metrics that align with your company’s size, model, and goals, and compare against reliable industry data to guide your decisions.
What is the rule of 40 in SaaS benchmark?
The Rule of 40 helps you measure whether your SaaS business is growing sustainably. It combines two key numbers: your revenue growth rate and your profit margin.
Here’s the simple formula:
Revenue Growth % + Profit Margin % = Rule of 40 Score
If the result is 40% or more, your company is considered financially healthy, especially in the eyes of investors.
Example:
- If you're growing at 50% and have a -10% profit margin, your score is 40%.
- If growth slows to 30%, you’ll need at least a 10% profit margin to stay on track.
This benchmark matters most for mid-to-late-stage companies trying to balance growth with efficiency. Early-stage SaaS startups may prioritize growth over margin, but the Rule of 40 becomes more relevant as the business scales.
How to Collect and Analyze SaaS Industry Benchmarks?
Start by identifying which B2B SaaS funnel conversion metrics matter to your business, then find reliable data to compare against trusted SaaS industry benchmark data.
Your goal is to find out how your performance stacks up, where you’re falling short, and what to fix. That requires the right inputs, consistent tracking, and fair comparisons.
Here’s how to do it step by step.
1. Choose metrics that match your goals
Pick metrics based on what you want to improve. Don't track CAC if retention is your real issue. Focus on benchmarks tied to growth, efficiency, or customer health.
Examples:
- Monthly Recurring Revenue (MRR)
- Annual Recurring Revenue (ARR)
- Customer Acquisition Cost (CAC)
- Customer Lifetime Value (CLTV)
- Net Revenue Retention (NRR)
- Churn Rate
- Net Promoter Score (NPS)
2. Use sources that make sense
Your benchmark is only useful if the comparison is fair. Avoid mismatches by comparing against companies with similar size, business models, and customer segments.
Where to find SaaS spending benchmarks:
- Reports: OpenView, a16z, SaaS Capital, KeyBanc
- Tools: Baremetrics, Paddle, Drivetrain
- Communities: Slack groups, peer networks, investor databases
- Internal systems: Billing, CRM, product analytics
3. Collect data from trusted systems
Start with your own tools:
- Billing tools (e.g., Stripe, Chargebee): Revenue, churn, expansion
- CRM (e.g., HubSpot, Salesforce): CAC, deal stages
- Analytics (e.g., Google Analytics, Mixpanel): Traffic, activation, usage
- Finance platforms (e.g., Drivetrain): Margin, burn, runway
Clean your data before comparing. If your CAC includes headcount but the benchmark doesn’t, the comparison won’t hold up.
4. Compare and look for gaps
Put your numbers next to the SaaS marketing benchmarks data and ask:
- Where are we overperforming?
- Where are we behind?
- Are there consistent patterns across quarters?
Focus on trends, not just one-time snapshots. Benchmarks are most useful when tracked over time.
5. Act, monitor, repeat
Benchmarking isn’t a one-off task. Use what you learn to adjust goals, optimize spend, or double down where you're leading.
- Create action plans for weak spots
- Re-benchmark quarterly to track improvement
- Share updates across teams to stay aligned
Revisit your benchmarks every quarter. What mattered six months ago might not matter now.
Using SaaS Metrics Benchmarks to Improve Performance
Benchmarks are only useful if they lead to action. Once you know how your metrics compare, the next step is to use that data to improve how you operate.
Here’s how to move from insight to impact:
1. Focus on the outliers
Start by identifying which metrics are furthest from industry averages. If your CAC is much higher than the benchmark, or your NRR is lagging, those are the areas to fix first.
Ask:
- Is this a strategy problem or an execution issue?
- Which team owns this metric?
- What are others doing differently?
2. Set realistic, benchmark-aligned goals
Use benchmark data to guide your targets. For example:
- If the average CAC payback is 12 months and yours is 18, aim to bring it down to 14 in the next quarter.
- If best-in-class churn is 4%, set an internal goal to get under 6% first.
Avoid setting arbitrary goals. Let the data show you what’s possible.
3. Prioritize what to fix (and what to leave)
Not every underperforming metric needs fixing right away. Focus on high-impact areas first, like churn, NRR, and CAC. These affect revenue and runway directly.
Use benchmarks to:
- Justify budget shifts
- Focus leadership conversations
- Avoid distractions from vanity metrics
4. Test, track, repeat
Once you act on a benchmark gap, don’t assume it’s solved. Build systems to track improvements.
- Run experiments
- Set quarterly check-ins
- Measure again and compare
Benchmarking isn’t a one-time activity. It’s how you stay sharp while scaling.
Bottom line: Benchmarks give your numbers meaning, but improvement comes from what you do next. Prioritize the gaps that matter, make focused changes, and measure every step.
Common Pitfalls in SaaS Benchmarking
SaaS benchmarking only works when it's done right, and most teams get it wrong in subtle ways.
Here are the most common mistakes SaaS companies make when benchmarking (and how to avoid them):
1. Benchmarking against the wrong companies
Not all benchmarks are created equal. Comparing your $2M ARR company to a public SaaS giant will mislead you.
Fix it: Choose benchmarks from companies with a similar size, stage, customer type, and sales model. If you’re PLG, don’t benchmark CAC against a purely sales-led business.
2. Tracking too many metrics
Teams often try to benchmark everything at once, which leads to noise, not insight.
Fix it: Stick to 3–5 metrics that align with your current goals. More data doesn’t mean better decisions.
3. Ignoring internal context
A metric that looks bad on paper might be just right for your model. High CAC may be fine if you have enterprise contracts with long retention.
Fix it: Balance external benchmarks with internal patterns and business logic. Always ask, “Does this apply to how we operate?”
4. Using inconsistent definitions
If you define churn one way and the benchmark defines it another, you’re comparing apples to oranges.
Fix it: Align your metric definitions with the sources you’re using. If necessary, normalize your data to match the benchmark methodology.
5. Treating benchmarking as a one-time exercise
Many teams run benchmarks once, share a report, and move on.
Fix it: Revisit your benchmarks quarterly. Your product, market, and goals will change; your benchmarks should, too.
How CloudEagle’s AI-Powered Price Benchmarking Can Benefit Your Company?
CloudEagle.ai helps you stop overpaying for SaaS by showing you exactly what others are paying, and how to negotiate better deals.
It’s not just about having pricing data. It’s about knowing how to use that data to reduce costs, improve vendor relationships, and simplify buying decisions.
Here’s how CloudEagle makes that happen:
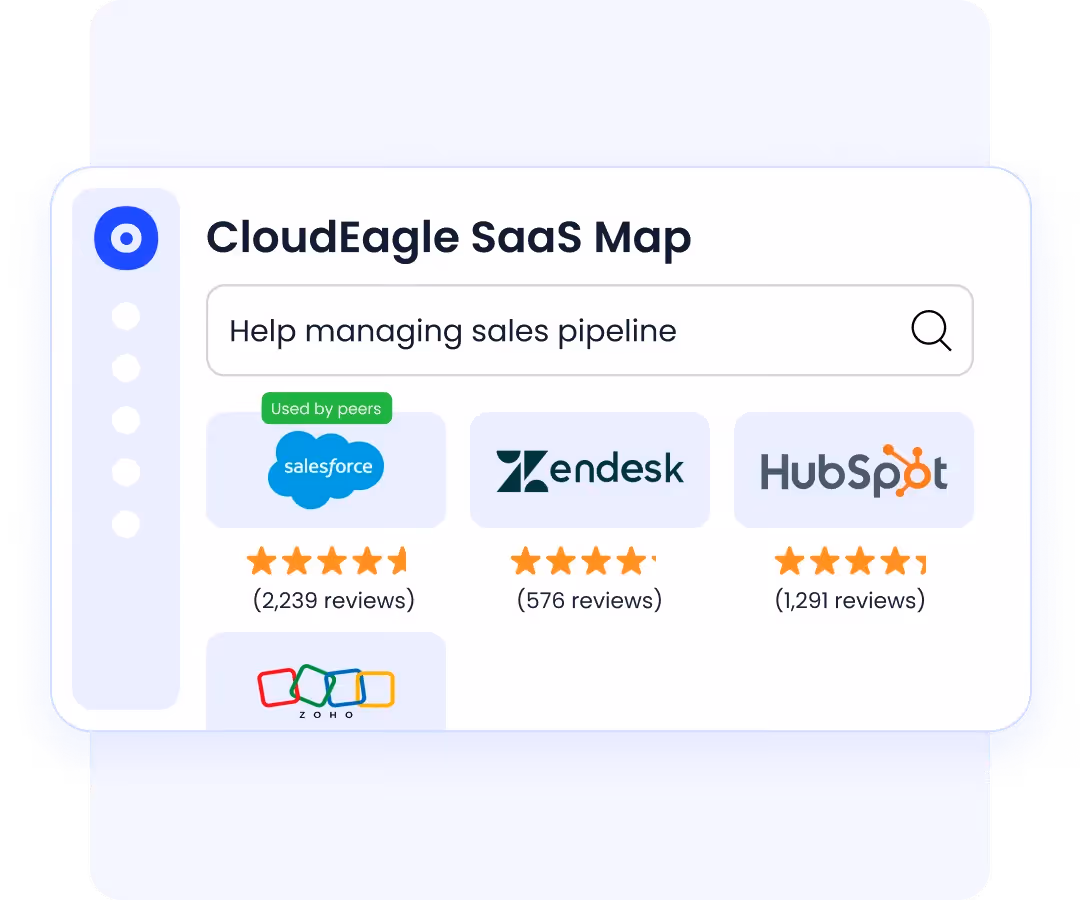
1. Get reliable pricing insights
CloudEagle analyzes over 2 billion transactions across 150,000+ vendors to give you real-time price benchmarking across 150,000+ vendors. That means you’re no longer guessing what a fair price looks like.
You get:
- Up-to-date pricing benchmarks
- Accurate cost per license by company size, contract term, and volume
- The confidence to negotiate with real numbers
2. Track pricing changes in real time
SaaS pricing changes constantly. CloudEagle.ai updates its data weekly, so you can catch fluctuations fast.
Example: If your competitor is paying $50/user for the same tool you're paying $85 for, CloudEagle.ai flags that pricing gap. You can take that insight straight to your vendor and renegotiate.

You’ll also get alerts when prices drop, so you never miss an opportunity to save.
3. Benchmark your current stack
CloudEagle doesn't just help with new purchases. It analyzes your existing contracts and benchmarks them against market trends.
- Spot overpriced tools in your stack
- Optimize renewals before the contract auto-renews
- Plan better procurement cycles with current market rates
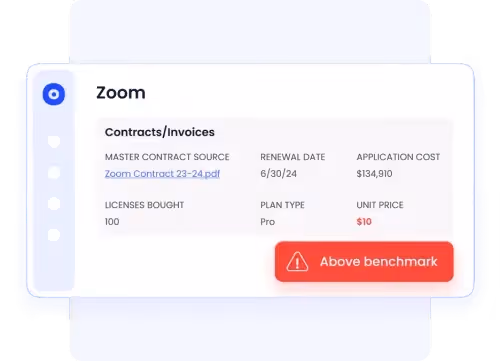
Whether it’s a 12-month license or a multi-year deal, you’ll know if you’re overpaying before the invoice hits.
4. Identify savings and consolidate spend
With AI-driven comparisons, CloudEagle highlights which tools are overpriced or redundant.
Example: If you’re using three marketing tools and one is far above the benchmark, you’ll get a clear signal to renegotiate, consolidate, or switch.
This helps you:
- Cut unnecessary costs
- Maximize contract value
- Keep spending aligned with usage
5. Negotiate better with expert-backed guides
Benchmark data is one thing, knowing how to use it is another. CloudEagle includes a SaaS buying guide for every tool, packed with:
- Discount trends across industries
- Tips for negotiating with specific vendors
- Community-sourced insights from other buyers
- Information on trials, credits, and contract flexibility
You can also connect with a SaaS buying expert to walk through negotiation strategy and pricing opportunities.
Real example: Benchmarking Zoom pricing
Looking at Zoom licenses for your team? CloudEagle shows you:
- Estimated cost by volume (e.g., $210–$246/user for 100–500 licenses, or $162–$180/user for 1000+ licenses)
- Discount thresholds by license tier
- Reseller availability and billing terms
- Plan-specific details and usage caps
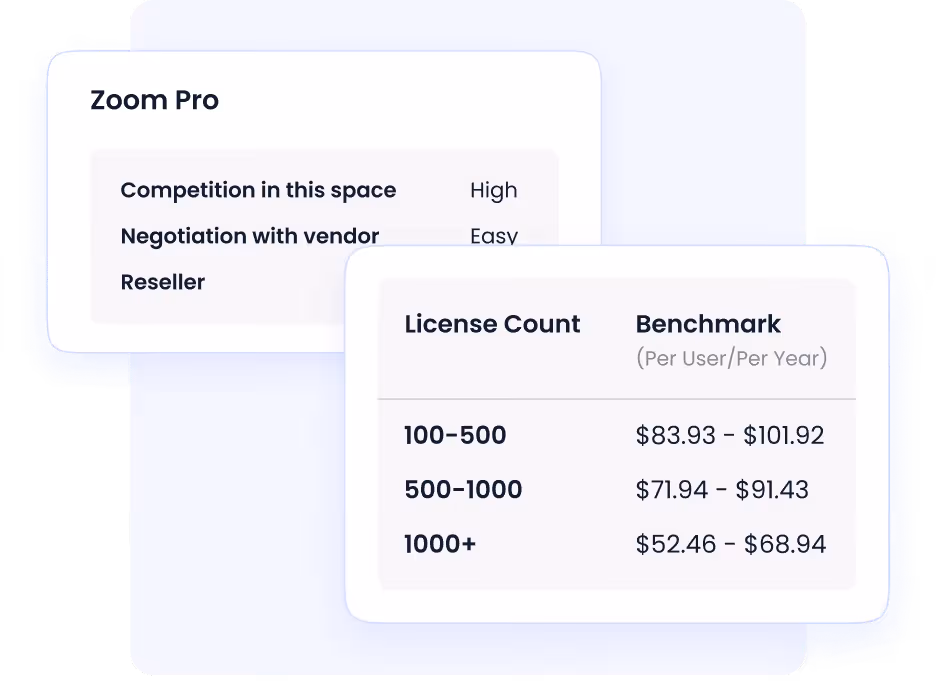
All in one dashboard. No spreadsheets, no guesswork.
CloudEagle’s AI-powered price benchmarking isn’t just a feature; it’s a way to take control of your SaaS spend. You don’t need to be a procurement expert. You just need the right data and the right tools to act on it.
And CloudEagle.ai gives you both.
Know the Gaps? Now Fix Them with CloudEagle
You now know what to measure, how to benchmark it, and where performance gaps might be hiding. That means you're already ahead of most teams.
- Benchmarking helps you prioritize what to fix
- The right metrics reveal where money’s leaking
- Industry data gives your goals real context
- Actionable insights drive smarter SaaS decisions
CloudEagle.ai makes that easier. With real-time price benchmarking and negotiation insights, it’s the extra brain your finance and procurement team didn’t know they needed. Use it to close gaps and save while you’re at it.
FAQs
1. What is the 3 3 2 2 2 rule of SaaS?
It’s a shorthand for ideal SaaS growth: triple revenue in years one and two (3x, 3x), then double in years three, four, and five (2x, 2x, 2x). It’s often used as a funding benchmark.
2. What is a KPI in SaaS?
A KPI (Key Performance Indicator) is a metric used to measure SaaS performance. Examples include MRR, CAC, churn rate, NRR, and LTV.
3. What is the SaaS benchmark?
A SaaS benchmark is a standard metric or data point used to compare your company’s performance against industry averages or similar businesses.
4. What is the benchmark for B2B SaaS churn?
For B2B SaaS, annual churn below 5–7% is considered strong. Anything higher may signal issues with onboarding, product fit, or customer support.


.avif)


.avif)
.avif)


.png)